Monday, June 13
Friday, June 10
Market Day
Once again we have seen what a success Market Day has been......check out what they have said about it in the paper!!!
MANAWATU STANDARD
Thursday, June 9
PrEP Market Day
 Well Market Day finally arrived today, and what a day it has been!!!!!!! Thank you for all of the support from parents who came to visit today! It was great to see you supporting all of the work you're children have done over the past 6 weeks! The children learned so much about working in the 'real world', from getting CV's and covering letters together to doing Market Research and producing a product or service. Many children have shown great leadership and orginisational skills and Lytton Street School are very proud of you!
Wednesday, June 1
Athletics Champs

After a long wait we finally found out the LSS athletics champions! Well done to Sarah who is the overall Year 6 girl champion. Sarah got first in shotput, high jump and sprints. Also, well done to Lily M who is the overall 3rd Year 5 girl. Lily got first in shotput, second in sprints and third in long jump.
Student of the Week
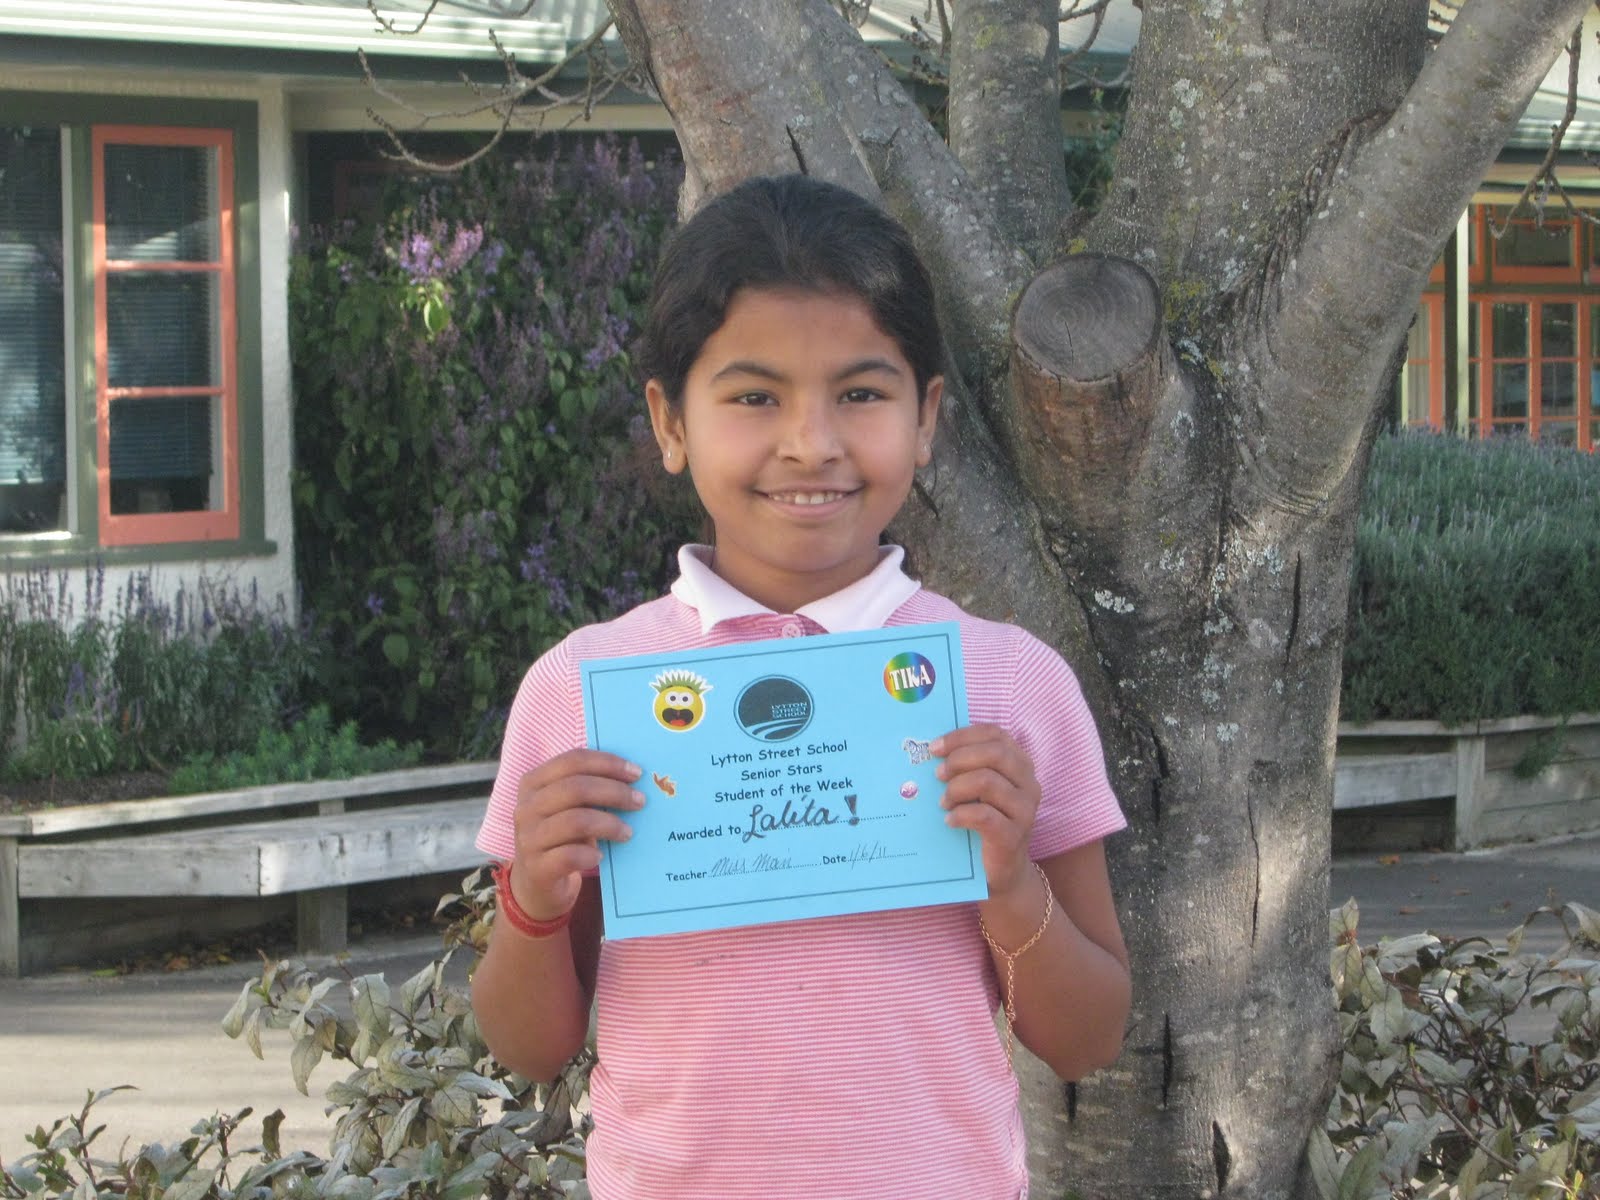 Congratulations to Lalita, Room 10's Student of the Week. Lalita is a great role model to all students at Lytton Street School and always completes her work to a high standard. You are a wonderful member of Room 10. Ka Pai Lalita
Friday, May 20
Statistics
 We were looking at the probability of throwing heads-heads, tails-tails or heads-tails. Our graph shows that heads-tails is most likely because it has a probability of 50% an the others only have a probability of 25%
Statistics
 We used pages to make this graph. It shows the results from when we threw two coins. We were looking at probability.

Statistics
 We had 40 counters, 20 blue and 20 pink after we got a counter out we didn't put it back in the container so the probability changed each time we pulled out a counter.
Statistics

The Tally Ho Chart Is About What Kind Of Burger At What Time?
We first made a tally chart then made a bar chart on Keynote
By Lily M And Shanleigh W


